Imagine you’re at your local plant nursery, browsing the plants or thumbing through the racks of seeds, trying to narrow down what you want to grow.
Before you start making decisions, you start looking at the growing requirements:
- Sun needs
- Planting depth
- Zone recommendations
Whether you’re a seasoned gardener or just learning, you’ve likely heard about the last one, specifically, plant hardiness zones. But there’s more to know about them than just their classification and temperatures.
United States plant hardiness zones attempted to standardize accumulated weather information tied to specific locations so you’d know which plants could reasonably survive where.
The United States Department Of Agriculture (USDA) Zone Hardiness Map has long been held as the authority.
But this wasn’t always the case….
A Brief History of Zone Maps in North America
Zone maps existed before the first USDA Hardiness Zone Map was released in 1960, most notably the one published by Harvard University’s Arnold Arboretum in 1927.
In his Manual of Cultivated Trees and Shrubs Hardy in North America, botanical taxonomist Alfred Rehder began interpreting the most up-to-date climate information of the time. From this, he created a map dividing the USA into eight temperature zones and sharing the lowest average temperature for the coldest month in each.
For the first time, gardeners could consult this map and determine which plants would likely survive in their area!
In 1938, a revised map was published in Hedges, Screens and Windbreaks, a different Arboretum publication. Its author, horticulturist Donald Wyman, built upon Rehder’s system and also used USDA climate data from 1895-1935.
As new temperature information became available throughout his career, Wyman continued to expand and update this work. In 1949, he published a map that included hardiness recommendations for the continental USA and southern Canada. Further updates occurred approximately every 10 years until the early 1970s.
When the USDA published its zone map in 1960, its zone information varied from the Arnold Arboretum’s.
Wyman’s zones had adhered to and built upon Rehder’s values (some zones had a 5-degree spread, others were 10, and still others were 15 degrees).
The new USDA map took a different approach, creating all zones to incorporate 10-degree and 5-degree subzones.
As you can imagine, the difference in the maps created confusion for gardeners.
By the early 1970s, the USDA system had been widely adopted, and the Arnold Arboretum focused on other work. They have continued to record temperature data and contribute information to the USDA from their two weather stations.
Why does this matter today to someone looking to understand plant hardiness zones? We’ll get to that, I promise.
First, we need to start with some basic hardiness zone information.
1 – Learn Basic Hardiness Zone Info

To put it simply, hardiness zones communicate where specific plants grow best. This allows you to easily choose perennial plants that will survive the winter in your location.
While several countries have developed zone systems for gardening, the system created by the USDA in the United States is widely adopted.
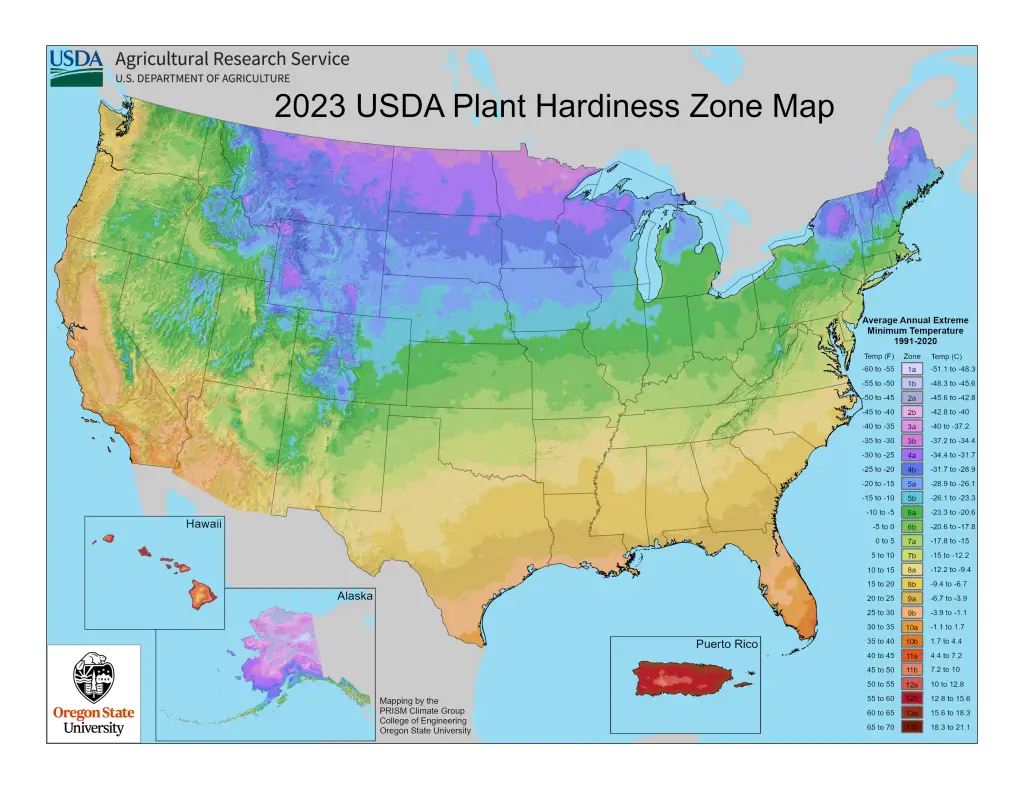
The map shows all of the USDA plant hardiness zones together.
These range from 1-13, with 1 being the coldest and 13 being the hottest.
Each zone provides information based on the area’s average low winter extreme temperatures over at least 30 years.
As you can probably imagine, locations in the north are cooler. Zone temperatures gradually warm up as you move further south.
That said, the nearby landscape, such as mountains, lakes, coasts, and deserts, all contribute to a climate in sometimes surprising ways. As such, areas at the same latitude are not always in the same zone. You can find 5b growing regions in New York and much more south in New Mexico, to give an example.
Subzones
Each zone covers a specific 10-degree Fahrenheit measurement and is further broken down into two 5-degree subzones.
The first 5 degrees is “a,” which is cooler. The second 5 degrees are “b,” which is warmer.
For example, zone 4a is -30°F (-34.44°C) to -25°F (-31.66°C), while zone 4b is -25°F (-31.66°C) to -20°F (-28.88°C).
2 – Find Your Hardiness Zone

Start with our hardiness zone maps and information. You can head to your specific state. There, you’ll find information about your hardiness zone, tips, plant suggestions, and more.
3 – Use What You Have Learned For Your Garden

In short, learn your hardiness zone and pick your plants accordingly. Seed packages and plant tags often show which growing zone(s) the plants are best suited for.
The USDA hardiness zone recommendations and plants selected for your area will give your plants the highest chance of survival, at least in the cold temperatures they can survive.
This is where the story of Donald Wyman, head of horticulture for Harvard’s Arnold Arboretum, comes in. It was 1940 when he wrote:
“Hardiness of plants is based not only on a plant’s resistance to minimum temperatures, but also on its resistance to maximum temperatures and other factors such as lack of water, exposure, soil conditions, length of growing season, etc. It would be impossible to prepare a map depicting all of these factors, though several might be included in a complex one. However, since a map based on the average annual minimum temperatures agrees in many instances with the known limits of hardiness of certain plants, these data were adopted as the basis for hardiness zones.”
It’s essential to know winter temperatures are only one part of what makes plants thrive in your garden. Several other factors affect their success. In fact, if you only followed plant hardiness zone information, you’d have no guarantee of their survival.
The USDA hardiness zone map can be useful for assessing unfamiliar locations and plants, but we advise you to use it as a starting point as you learn more about gardening.

